Primary_outcomes
Primary_outcomes.RmdLoad data
#library(librarian)
#librarian::shelf(here, readxl, metafor, quiet = TRUE)

dat <- readxl::read_excel(here::here("data", "Dex_metan.xlsx"),
                  range = "B3:AB11",
                  col_names=c("study", "n1i", "n2i",
                              "ai_atel", "bi_atel", "ci_atel", "di_atel", "per_dex_atel", "per_con_atel",
                              "ai_pneu", "bi_pneu", "ci_pneu", "di_pneu", "per_dex_pneu", "per_con_pneu",
                              "ai_hypo", "bi_hypo", "ci_hypo", "di_hypo", "per_dex_hypo", "per_con_hypo",
                              "ai_ards", "bi_ards", "ci_ards", "di_ards", "per_dex_ards", "per_con_ards")
                  )
print(dat, width=Inf)
#> # A tibble: 9 × 27
#>   study           n1i   n2i ai_atel bi_atel ci_atel di_atel per_dex_atel
#>   <chr>         <dbl> <dbl>   <dbl>   <dbl>   <dbl>   <dbl> <chr>
#> 1 Shi et al        60    60       1       3      59      57 1.7% (1/60)
#> 2 Xie et al        58    58       0       2      58      56 0.0% (0/58)
#> 3 Meng et al       20    20       1       2      19      18 5.0% (1/20)
#> 4 Zhang et al      28    28       0       4      28      24 0.0% (0/28)
#> 5 Wu et al         NA    NA      NA      NA      NA      NA NA
#> 6 Jannu et al      40    40       3       2      37      38 7.5% (3/40)
#> 7 Lee et al (1)    25    25       0       4      25      21 0.0% (0/25)
#> 8 Lee et al (2)    50    50       2       3      48      47 4.0% (2/50)
#> 9 Zhou et al       59    53       1       3      58      50 1.7% (1/59)
#>   per_con_atel ai_pneu bi_pneu ci_pneu di_pneu per_dex_pneu per_con_pneu ai_hypo
#>   <chr>          <dbl>   <dbl>   <dbl>   <dbl> <chr>        <chr>          <dbl>
#> 1 5.0% (3/60)        3       4      57      56 5.0% (3/60)  6.7% (4/60)        4
#> 2 3.4% (2/58)        1       4      57      54 1.7% (1/58)  6.9% (4/58)        1
#> 3 10.0% (2/20)       2       2      18      18 10.0% (2/20) 10.0% (2/20)      NA
#> 4 14.3% (4/28)      NA      NA      NA      NA NA           NA                NA
#> 5 NA                 0       1      30      29 0.0% (0/30)  3.3% (1/30)       NA
#> 6 5.0% (2/40)        2       2      38      38 5.0% (2/40)  5.0% (2/40)       NA
#> 7 16.0% (4/25)      NA      NA      NA      NA NA           NA                NA
#> 8 6.0% (3/50)        1       2      49      48 2.0% (1/50)  4.0% (2/50)       NA
#> 9 5.7% (3/53)        1       3      58      50 1.7% (1/59)  5.7% (3/53)        1
#>   bi_hypo ci_hypo di_hypo per_dex_hypo per_con_hypo  ai_ards bi_ards ci_ards
#>     <dbl>   <dbl>   <dbl> <chr>        <chr>           <dbl>   <dbl>   <dbl>
#> 1      12      56      48 6.7% (4/60)  20.0% (12/60)       1       2      59
#> 2       4      57      54 1.7% (1/58)  6.9% (4/58)        NA      NA      NA
#> 3      NA      NA      NA NA           NA                 NA      NA      NA
#> 4      NA      NA      NA NA           NA                  0       1      28
#> 5      NA      NA      NA NA           NA                 NA      NA      NA
#> 6      NA      NA      NA NA           NA                 NA      NA      NA
#> 7      NA      NA      NA NA           NA                  0       1      25
#> 8      NA      NA      NA NA           NA                 NA      NA      NA
#> 9       4      58      49 1.7% (1/59)  7.5% (4/53)        NA      NA      NA
#>   di_ards per_dex_ards per_con_ards
#>     <dbl> <chr>        <chr>
#> 1      58 1.7% (1/60)  3.3% (2/60)
#> 2      NA NA           NA
#> 3      NA NA           NA
#> 4      27 0.0% (0/28)  3.6% (1/28)
#> 5      NA NA           NA
#> 6      NA NA           NA
#> 7      24 0.0% (0/25)  4.0% (1/25)
#> 8      NA NA           NA
#> 9      NA NA           NA
Did not include final two rows containing Quingming et al., as these are not included in the meta-analysis paper.
Wu et al. is missing sample size data. The sample size is 30 on each arm, and can be inferred by the pneumonia data. Add this:
wu.row <- which(dat$study=="Wu et al")
dat[wu.row, "n1i"] <- 30
dat[wu.row, "n2i"] <- 30
For the subgroup analysis based on TV, we must add this TV do the data:
TV.6.or.less <- c("No", # Shi
                  "Yes", # Xie
                  "No", # Meng
                  "Yes", # Zhang
                  "Yes", # Wu
                  NA, # Jannu
                  "Yes", # Lee (n=50)
                  NA, # Lee (n=100)
                  NA # Zhou
                  )
dat$TV.6.or.less <- TV.6.or.less
Descriptive statistics
In the meta-analysis, there are 370 participants in the dex group and 364 participants in the control group.
Atelectasis
For Atelectasis: risk on dex is 2.4%, risk on control is 6.9%. Risk difference is 4.5%, risk ratio is 0.34.
Pneumonia
For pneumonia: risk on dex is 3.2%, risk on control is 5.8%. Risk difference is 2.6%, risk ratio is 0.55.
Main Analysis
Atelectasis
# test.dat <- dat[study.index.atel, c("study", "n1i", "n2i",
#                         "ai_atel", "bi_atel", "ci_atel", "di_atel")]
dat.atelectasis <- metafor::escalc(measure="OR",
                          ai=ai_atel,
                          bi=bi_atel,
                          ci=ci_atel,
                          di=di_atel,
                          data=dat,
                          slab = study)
pm.atelectasis <- metafor::rma(yi, vi, data=dat.atelectasis, method="PM")
# metafor::regtest(pm.atelectasis)
# metafor::regtest(pm.atelectasis, model="lm")
metafor::forest(pm.atelectasis,
       atransf=exp,
       at=log(c(0.002, 0.01, 0.03, 0.1, 0.4, 2, 5, 10)))
Pneumonia
dat.pneumonia <- metafor::escalc(measure="OR",
                          ai=ai_pneu,
                          bi=bi_pneu,
                          ci=ci_pneu,
                          di=di_pneu,
                          data=dat,
                          slab = study)

pm.pneumonia <- metafor::rma(yi, vi, data=dat.pneumonia, method="PM")
# metafor::regtest(pm.pneumonia)
# metafor::regtest(pm.pneumonia, model="lm")
metafor::forest(pm.pneumonia,
       atransf=exp,
       at=log(c(0.002, 0.01, 0.03, 0.1, 0.4, 2, 5, 10)))
Hypoxemia
dat.hypoxemia <- metafor::escalc(measure="OR",
                        ai=ai_hypo,
                        bi=bi_hypo,
                        ci=ci_hypo,
                        di=di_hypo,
                        data=dat,
                        slab = study)

pm.hypoxemia <- metafor::rma(yi, vi, data=dat.hypoxemia, method="PM")
# metafor::regtest(pm.hypoxemia)
# metafor::regtest(pm.hypoxemia, model="lm")
metafor::forest(pm.hypoxemia,
       atransf=exp,
       at=log(c(0.002, 0.01, 0.03, 0.1, 0.4, 2, 5, 10)))
ARDS
dat.ards <- metafor::escalc(measure="OR",
                        ai=ai_ards,
                        bi=bi_ards,
                        ci=ci_ards,
                        di=di_ards,
                        data=dat,
                        slab = study)

pm.ards <- metafor::rma(yi, vi, data=dat.ards, method="PM")
# metafor::regtest(pm.ards)
# metafor::regtest(pm.ards, model="lm")
metafor::forest(pm.ards,
       atransf=exp,
       at=log(c(0.002, 0.01, 0.03, 0.1, 0.4, 2, 5, 10)))
Note: n=3 here, but n=2 in metafor::forest plot in PDF. Which is
correct?
Note: n=3 here, but n=2 in metafor::forest plot in PDF. Which is
correct?
Sensitivity Analysis
HKSJ correction results in narrower CIs:
pmhk.atelectasis <- metafor::rma(yi, vi, data=dat.atelectasis, method="PM", test="knha")
metafor::forest(pmhk.atelectasis,
                atransf=exp,
                at=log(c(0.002, 0.01, 0.03, 0.1, 0.4, 1, 2, 5, 10)),
                ilab = cbind(ai_atel, n1i, bi_atel, n2i),
                ilab.xpos = c(-9.5,-8.5,-7.5,-6.5),
                cex=.75, header=c("Author(s) and Year"),
                xlab=""
)
text(c(-9.5,-8.5,-7.5,-6.5), pmhk.atelectasis$k+1.5, c("E", "T", "E", "T"), cex=0.75)
text(c(-9,-7),     pmhk.atelectasis$k+2, c("Dexmed.", "Placebo"), cex=0.75)
par(xpd=NA)
text(log(c(0.001, 45)), -4, c("Favours Dexmedetomidine","Favours Placebo"), pos=c(4,2), offset=-0.5, cex=0.75)
pmhk.pneumonia <- metafor::rma(yi, vi, data=dat.pneumonia, method="PM", test="knha")
metafor::forest(pmhk.pneumonia,
                atransf=exp,
                at=log(c(0.002, 0.01, 0.03, 0.1, 0.4, 1, 2, 5, 10)),
                ilab = cbind(ai_pneu, n1i, bi_pneu, n2i),
                ilab.xpos = c(-9.5,-8.5,-7.5,-6.5)+1.75,
                cex=.75, header=c("Author(s) and Year"),
                xlab=""
)
text(c(-9.5,-8.5,-7.5,-6.5)+1.75, pmhk.pneumonia$k+1.5, c("E", "T", "E", "T"), cex=0.75)
text(c(-9,-7)+1.75,     pmhk.pneumonia$k+2, c("Dexmed.", "Placebo"), cex=0.75)
par(xpd=NA)
text(log(c(0.005, 45)), -4, c("Favours Dexmedetomidine","Favours Placebo"), pos=c(4,2), offset=-0.5, cex=0.75)
pmhk.hypoxemia <- metafor::rma(yi, vi, data=dat.hypoxemia, method="PM", test="knha")
metafor::forest(pmhk.hypoxemia,
                atransf=exp,
                at=log(c(0.002, 0.01, 0.03, 0.1, 0.4, 1, 2, 5, 10)),
                ilab = cbind(ai_hypo, n1i, bi_hypo, n2i),
                ilab.xpos = c(-7.5,-7,-6.5,-6)+1.75,
                cex=.75, header=c("Author(s) and Year"),
                xlab=""
)
text(c(-7.5,-7,-6.5,-6)+1.75, pmhk.hypoxemia$k+1.5, c("E", "T", "E", "T"), cex=0.75)
text(c(-7.25,-6)+1.75,     pmhk.hypoxemia$k+2, c("Dexmed.", "Placebo"), cex=0.75)
par(xpd=NA)
text(log(c(0.005, 40)), -3, c("Favours Dexmedetomidine","Favours Placebo"), pos=c(4,2), offset=-0.5, cex=0.75)
pmhk.ards <- metafor::rma(yi, vi, data=dat.ards, method="PM", test="knha")
metafor::forest(pmhk.ards,
                atransf=exp,
                at=log(c(0.002, 0.01, 0.03, 0.1, 0.4, 1, 2, 5, 10)),
                ilab = cbind(ai_ards, n1i, bi_ards, n2i),
                ilab.xpos = c(-9.5,-8.5,-7.5,-6.5)+1.75,
                cex=.75, header=c("Author(s) and Year"),
                xlab=""
)
text(c(-9.5,-8.5,-7.5,-6.5)+1.75, pmhk.ards$k+1.5, c("E", "T", "E", "T"), cex=0.75)
text(c(-9,-7)+1.75,     pmhk.ards$k+2, c("Dexmed.", "Placebo"), cex=0.75)
par(xpd=NA)
text(log(c(0.005, 45)), -3.5, c("Favours Dexmedetomidine","Favours Placebo"), pos=c(4,2), offset=-0.5, cex=0.75)
Funnel plots
# Atelectasis:
### carry out trim-and-fill analysis
taf.atelectasis <- metafor::trimfill(pm.atelectasis)
### draw funnel plot with missing studies filled in
metafor::funnel(taf.atelectasis, legend=TRUE)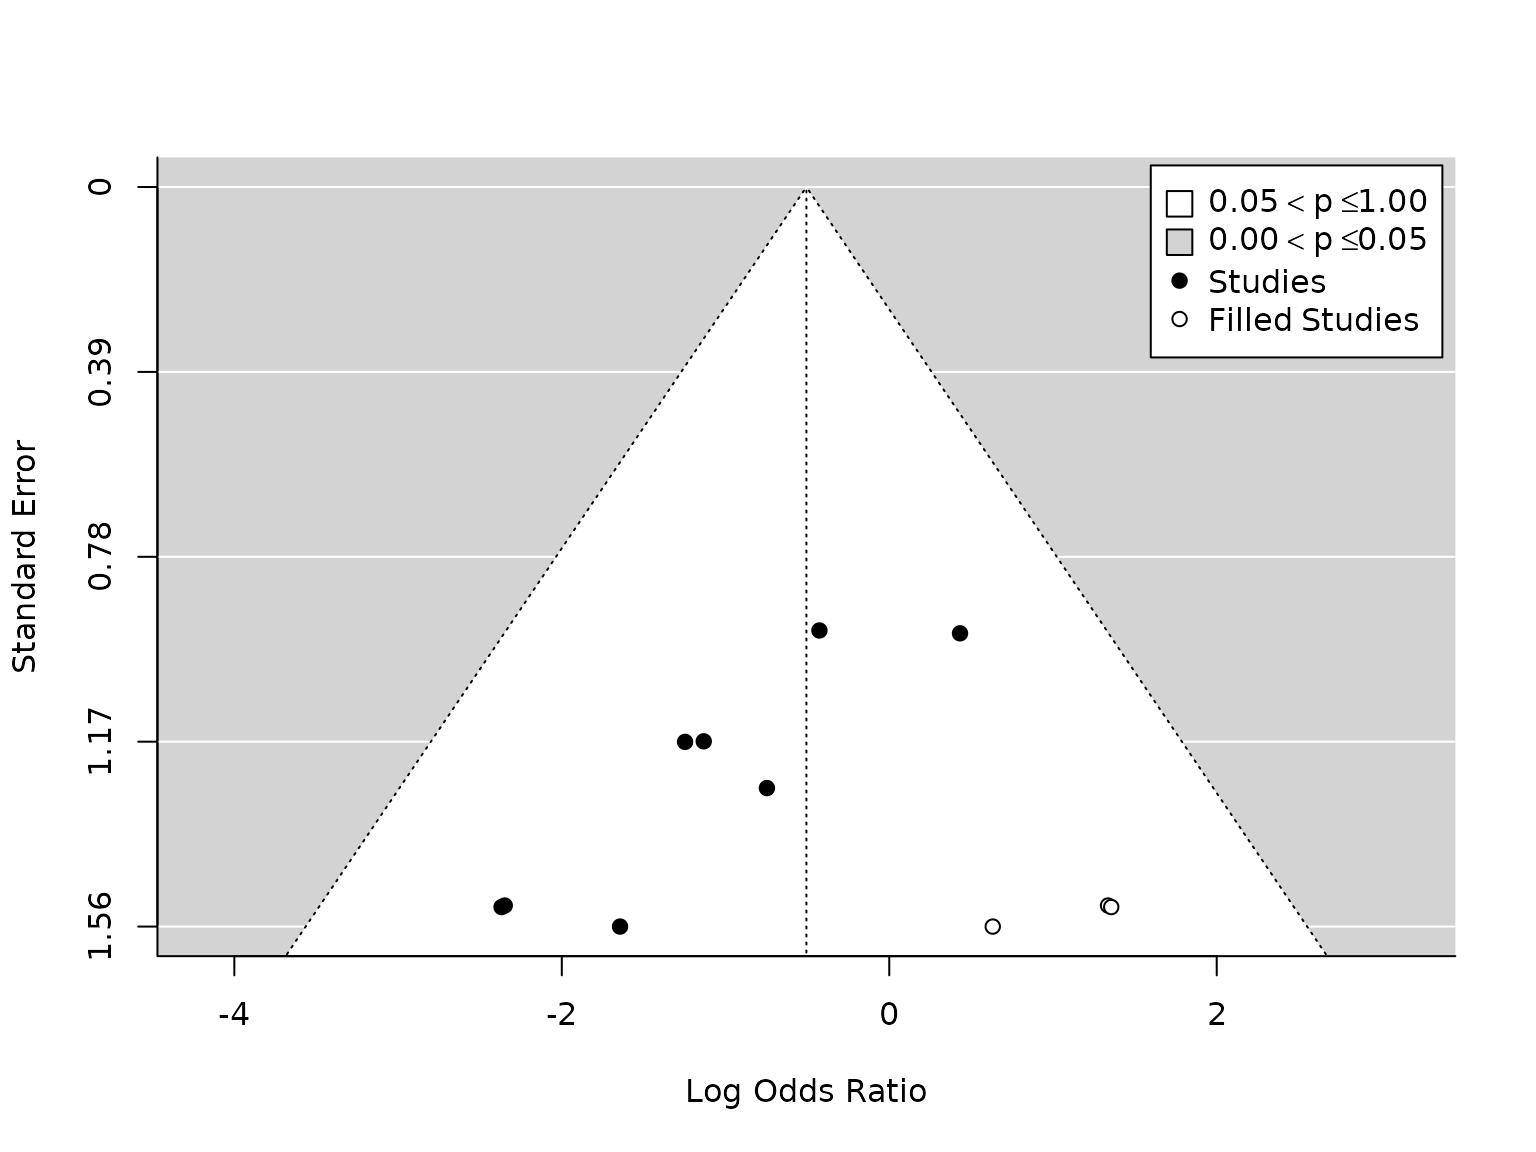
# OR and CI:
exp(taf.atelectasis$beta)
#>              [,1]
#> intrcpt 0.6028603
c(exp(taf.atelectasis$beta-taf.atelectasis$se), exp(taf.atelectasis$beta+taf.atelectasis$se))
#> [1] 0.4121106 0.8819004

# Pneumonia
taf.pneumonia <- metafor::trimfill(pm.pneumonia)
metafor::funnel(taf.pneumonia, legend=TRUE)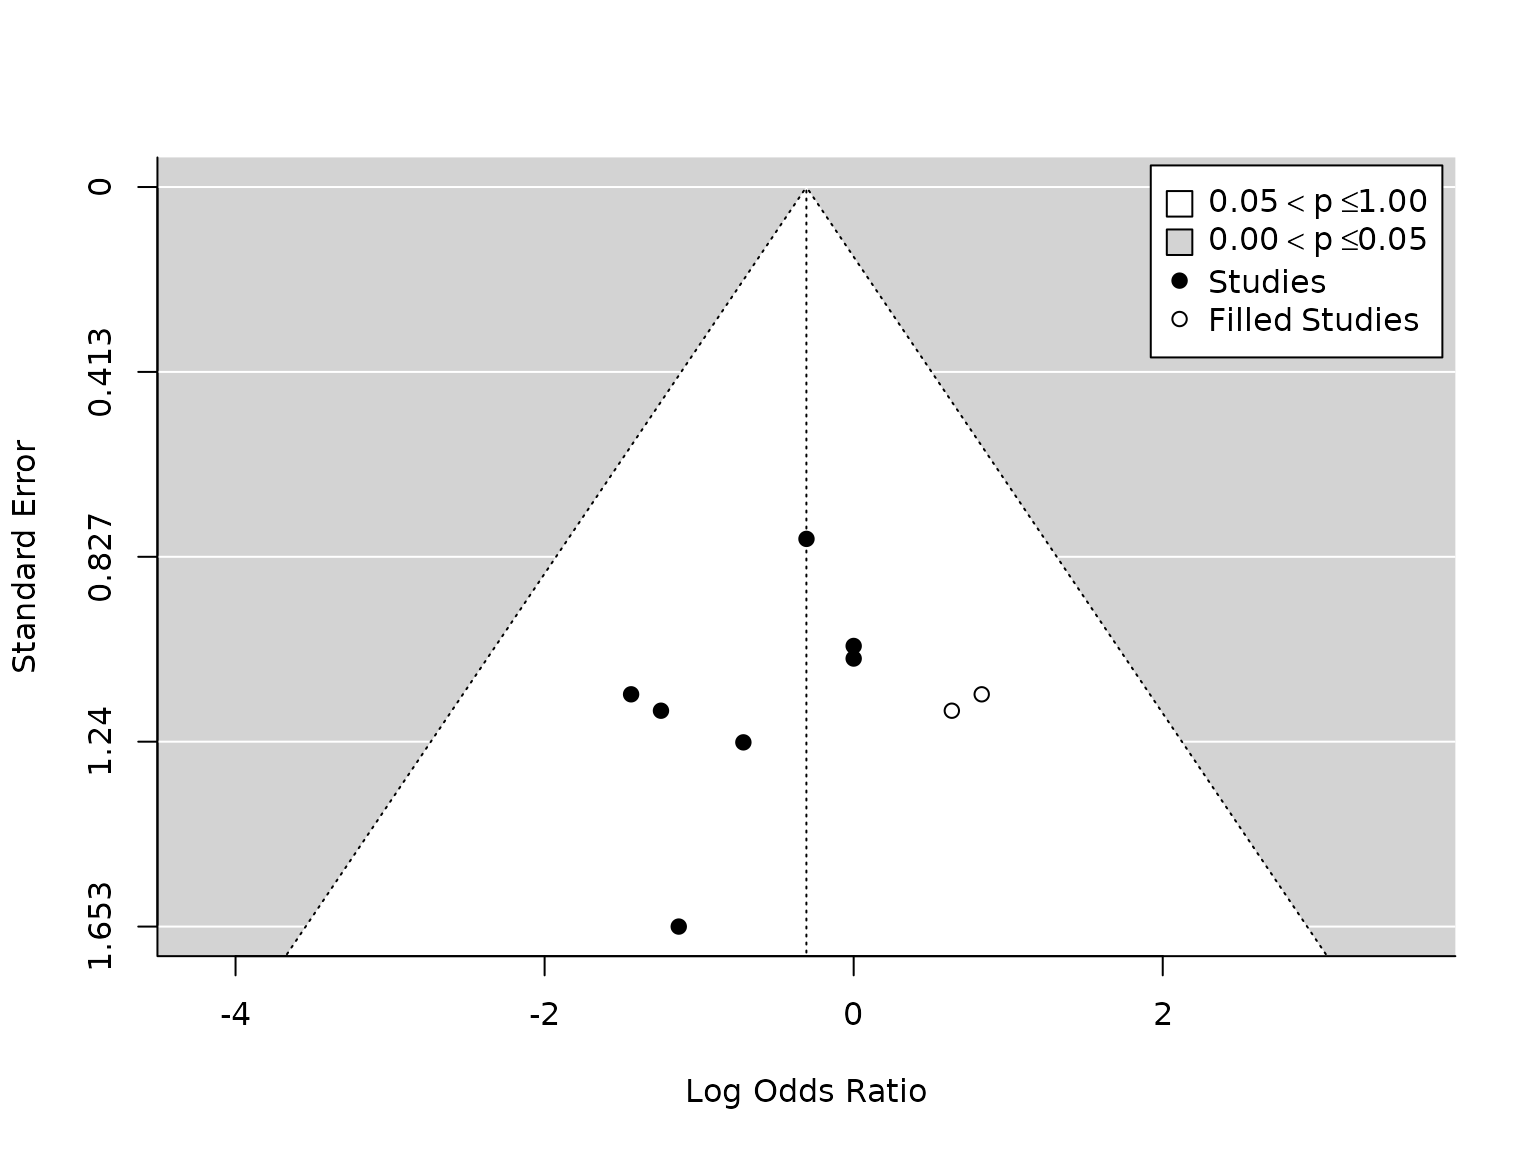
# OR and CI:
exp(taf.pneumonia$beta)
#>             [,1]
#> intrcpt 0.736445
c(exp(taf.pneumonia$beta-taf.pneumonia$se), exp(taf.pneumonia$beta+taf.pneumonia$se))
#> [1] 0.5111027 1.0611392
Trim-and-fill analysis on the atelectasis meta-analysis data estimates that there are three studies missing. Removing the most extreme studies until there is no asymmetry results in a summary estimate of 0.60 (95% CI (0.41, 0.88)), which is smaller but still statistically significant. However, we acknowledge that this procedure the total number of studies is small,
Subgroup analysis: TV
Atelectasis
TV <=6mL/kg
dat.atelectasis.TV.lo <- metafor::escalc(measure="OR",
                          ai=ai_atel,
                          bi=bi_atel,
                          ci=ci_atel,
                          di=di_atel,
                          data=dat,
                          slab = study,
                          subset=TV.6.or.less=="Yes")
pm.atelectasis.TV.lo <- metafor::rma(yi, vi, data=dat.atelectasis.TV.lo, method="PM")
metafor::forest(pm.atelectasis.TV.lo,
                atransf=exp,
                at=log(c(0.002, 0.01, 0.03, 0.1, 0.4, 1, 2, 5, 10)),
                ilab = cbind(ai_atel, n1i, bi_atel, n2i),
                ilab.xpos = c(-9.5,-8.5,-7.5,-6.5)+0.7,
                cex=.75, header=c("Author(s) and Year"),
                xlab=""
)
text(c(-9.5,-8.5,-7.5,-6.5)+0.7, pm.atelectasis.TV.lo$k+1.5, c("E", "T", "E", "T"), cex=0.75)
text(c(-9,-7)+0.7,     pm.atelectasis.TV.lo$k+2, c("Dexmed.", "Placebo"), cex=0.75)
par(xpd=NA)
text(log(c(0.005, 45)), -2.8, c("Favours Dexmedetomidine","Favours Placebo"), pos=c(4,2), offset=-0.5, cex=0.75)
TV >6mL/kg
dat.atelectasis.TV.hi <- metafor::escalc(measure="OR",
                          ai=ai_atel,
                          bi=bi_atel,
                          ci=ci_atel,
                          di=di_atel,
                          data=dat,
                          slab = study,
                          subset=TV.6.or.less=="No")
pm.atelectasis.TV.hi <- metafor::rma(yi, vi, data=dat.atelectasis.TV.hi, method="PM")
metafor::forest(pm.atelectasis.TV.hi,
                atransf=exp,
                at=log(c(0.002, 0.01, 0.03, 0.1, 0.4, 1, 2, 5, 10)),
                ilab = cbind(ai_atel, n1i, bi_atel, n2i),
                ilab.xpos = c(-9.5,-8.5,-7.5,-6.5)+2.5,
                cex=.75, header=c("Author(s) and Year"),
                xlab="",
                xlim=c(-13, 8)
)
text(c(-9.5,-8.5,-7.5,-6.5)+2.5, pm.atelectasis.TV.hi$k+1.5, c("E", "T", "E", "T"), cex=0.75)
text(c(-9,-7)+2.5,     pm.atelectasis.TV.hi$k+2, c("Dexmed.", "Placebo"), cex=0.75)
par(xpd=NA)
text(log(c(0.005, 45)), -2.8, c("Favours Dexmedetomidine","Favours Placebo"), pos=c(4,2), offset=-0.5, cex=0.75)
Pneumonia
TV <=6mL/kg
dat.pneumonia.TV.lo <- metafor::escalc(measure="OR",
                          ai=ai_pneu,
                          bi=bi_pneu,
                          ci=ci_pneu,
                          di=di_pneu,
                          data=dat,
                          slab = study,
                          subset=TV.6.or.less=="Yes")
pm.pneumonia.TV.lo <- metafor::rma(yi, vi, data=dat.pneumonia.TV.lo, method="PM")
metafor::forest(pm.pneumonia.TV.lo,
                atransf=exp,
                at=log(c(0.002, 0.01, 0.03, 0.1, 0.4, 1, 2, 5, 10)),
                ilab = cbind(ai_pneu, n1i, bi_pneu, n2i),
                ilab.xpos = c(-9.5,-8.5,-7.5,-6.5)+1.75,
                cex=.75, header=c("Author(s) and Year"),
                xlab=""
)
text(c(-9.5,-8.5,-7.5,-6.5)+1.75, pm.pneumonia.TV.lo$k+1.5, c("E", "T", "E", "T"), cex=0.75)
text(c(-9,-7)+1.75,     pm.pneumonia.TV.lo$k+2, c("Dexmed.", "Placebo"), cex=0.75)
par(xpd=NA)
text(log(c(0.005, 45)), -2.8, c("Favours Dexmedetomidine","Favours Placebo"), pos=c(4,2), offset=-0.5, cex=0.75)
TV >6mL/kg
dat.pneumonia.TV.hi <- metafor::escalc(measure="OR",
                          ai=ai_pneu,
                          bi=bi_pneu,
                          ci=ci_pneu,
                          di=di_pneu,
                          data=dat,
                          slab = study,
                          subset=TV.6.or.less=="No")
pm.pneumonia.TV.hi <- metafor::rma(yi, vi, data=dat.pneumonia.TV.hi, method="PM")

metafor::forest(pm.pneumonia.TV.hi,
                atransf=exp,
                at=log(c(0.01, 0.03, 0.1, 0.4, 1, 2, 5, 10, 20)),
                ilab = cbind(ai_pneu, n1i, bi_pneu, n2i),
                ilab.xpos = c(-9.5,-8.5,-7.5,-6.5)+4,
                cex=.75, header=c("Author(s) and Year"),
                xlab="",
                xlim=c(-9, 7)
)
text(c(-9.5,-8.5,-7.5,-6.5)+4, pm.pneumonia.TV.hi$k+1.5, c("E", "T", "E", "T"), cex=0.75)
text(c(-9,-7)+4,     pm.pneumonia.TV.hi$k+2, c("Dexmed.", "Placebo"), cex=0.75)
par(xpd=NA)
text(log(c(0.005, 45)), -2.8, c("Favours Dexmedetomidine","Favours Placebo"), pos=c(4,2), offset=-0.5, cex=0.75)